
India's IIP Growth Hits 8% in August 2026: Manufacturing, Base Effect and UPSC Takeaways
Updated: 30 September 2026
UPSC focus: GS III - Indian economy and industrial growth
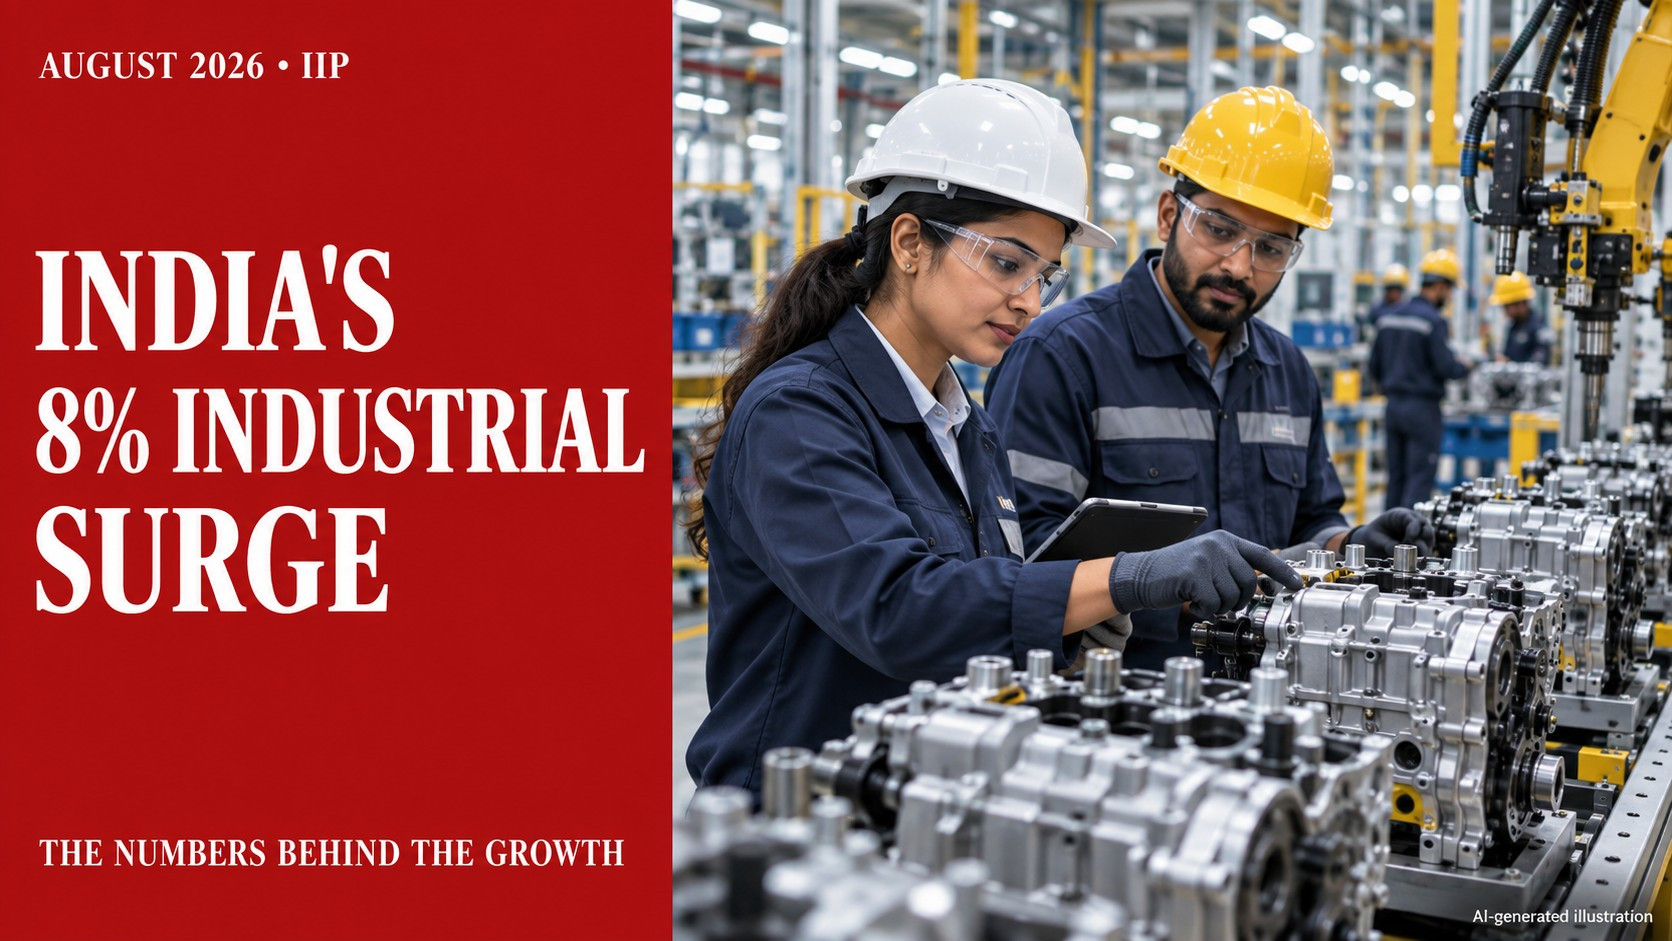
AI-generated illustration of a fictional factory. Not a photograph of a specific company or event.
India's industrial production grew 8% year-on-year in August 2026, with manufacturing expanding 9%. That is encouraging, but the headline does not tell the whole story: mining contracted, consumer non-durables grew slowly, and a favourable base helped lift the growth rate.
For UPSC, this release is a chance to revise the Index of Industrial Production (IIP), its new base year and the difference between a growth rate and an output level.
Why is IIP in the news?
The August 2026 quick estimates, released on 28 September, show stronger industrial output than a year earlier. The index stood at 123.3, compared with 114.2 in August 2025.
These are quick estimates, not immutable final numbers. They can change when more production data arrives. July's figures were revised alongside the August release.
What does IIP measure?
The Ministry of Statistics and Programme Implementation's FAQ describes IIP as a composite indicator of changes in the volume of production of an item basket relative to a base year. It is compiled and released by the National Statistics Office (NSO), MoSPI.
IIP is not a price index. It is also not a measure of the entire economy, because industrial production is only part of economic activity.
Important update: the base year is 2022-23
The current series uses 2022-23 = 100, replacing the older 2011-12 base. Updating the base year helps the index reflect changes in products, technology and the structure of industry.
The current series covers four broad sectors:
- Mining and quarrying.
- Manufacturing.
- Electricity and gas supply.
- Water supply, sewerage and waste management.
Prelims trap: Do not automatically repeat the old three-sector list or the 2011-12 base from an older textbook.
August 2026: the sectoral picture
| Sector | Year-on-year growth |
|---|---|
| Overall IIP | 8.0% |
| Manufacturing | 9.0% |
| Electricity and gas supply | 12.3% |
| Water supply, sewerage and waste management | 6.3% |
| Mining and quarrying | -5.6% |
Manufacturing was a major driver. 18 of its 23 industry groups recorded positive year-on-year growth. Electrical equipment and motor vehicles were among the strong performers.
However, an overall increase does not mean every sector grew. Mining's contraction is a useful reminder to read the composition of growth, not only the headline.
What is the base effect?
Year-on-year growth compares this month's output with the same month a year earlier. If that earlier level was unusually low, the percentage increase can look strong even without a large recent jump in production.
The Indian Express's analysis notes that August's favourable base helped the headline growth rate, even though overall output was lower than in July.
Simple illustration: An index moving from 100 to 108 is an 8% rise. That calculation alone does not tell you whether output rose or fell compared with the immediately preceding month.
This is separate from base-year revision. Base effect concerns the comparison period; base-year revision changes the index's reference year and framework.
What do use-based categories tell us?
A second way to read IIP is by the purpose of the goods produced. August's capital-goods output rose 16.9%, intermediate goods 13.7%, consumer durables 11.1%, and consumer non-durables 2.1%.
Capital goods can help assess investment-related production. Consumer categories help assess the production of goods bought by households. The gap between durables and non-durables suggests an uneven production picture; it is not proof that every household's spending has improved.
GS III answer-writing points
The release suggests stronger manufacturing and investment-linked activity, but a balanced answer should discuss:
- Breadth: Which sectors and product groups contributed, and which lagged?
- Comparison: Is the figure year-on-year or month-on-month? Is a base effect involved?
- Data quality: Are the figures quick estimates or revised numbers?
- Limits: Production data alone does not establish economy-wide employment growth, household welfare or future GDP growth.
Practice question, not an official UPSC question: "Why should industrial growth be assessed beyond the headline IIP growth rate? Discuss with reference to sectoral composition and the base effect." (150 words)
Sources
- MoSPI: FAQ on the new IIP series, base year 2022-23
- DD News: August 2026 IIP release and sectoral results
- Mint: August industrial output and the new series
- Indian Express: August output, manufacturing and the base effect
Plan your UPSC revision



.png)
Post a Comment